Prompt
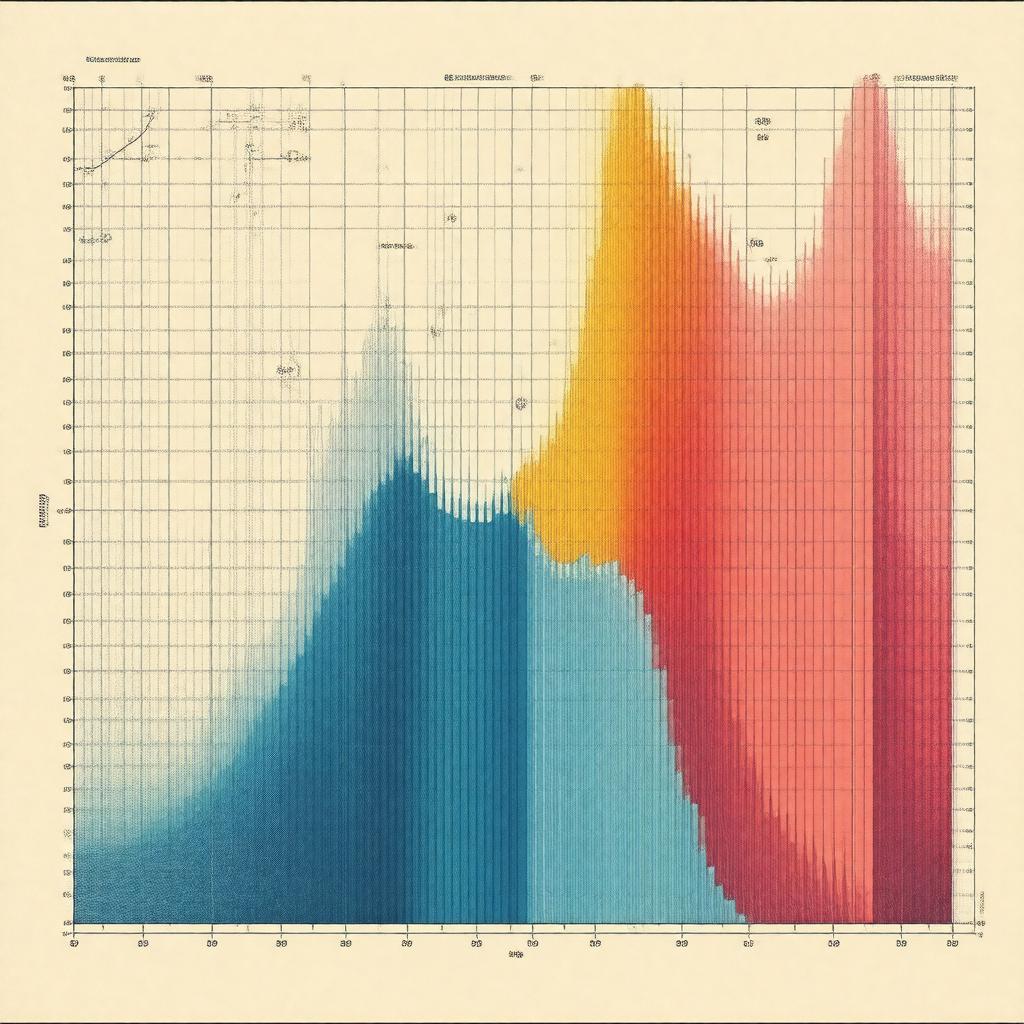
"Illustrate a stylized graph showing a histogram of sample means approaching a normal distribution curve, with a large number of independent random variables on the x-axis and their means on the y-axis, surrounded by subtle mathematical symbols and notations, in a minimalist and modern style."

