Prompt
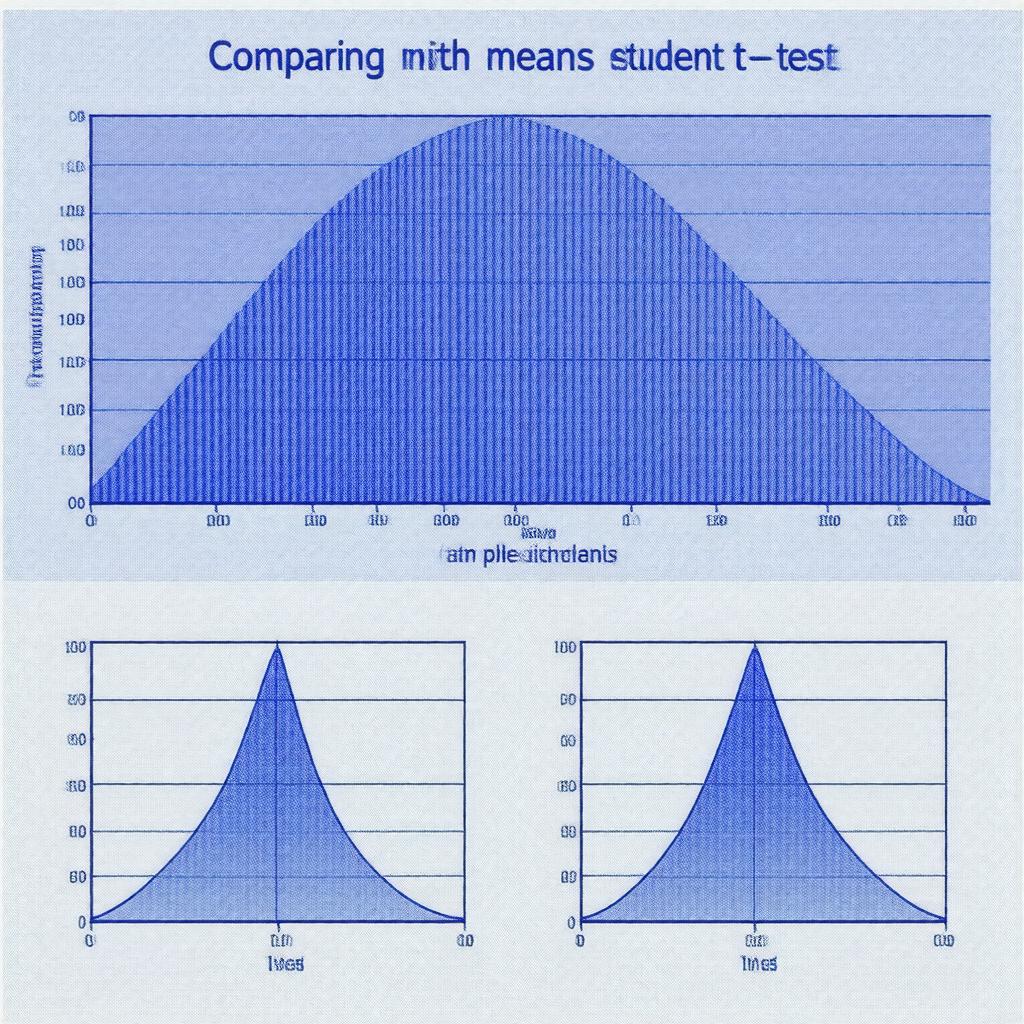
"Generate an image of a graph showing a bell-curve distribution with a shaded region representing the probability density of a t-value, alongside a diagram of two sample distributions with different means and a caption 'Comparing means with Student's t-test', in a style suitable for a statistics textbook, with a color scheme of blues and whites."

